As I do every year (and I am a bit late this year), I compile and analyze all of the sales in Coconut Grove (per MLS data – which takes me several weeks) over the previous year and look at where our community is trending. Once again, Coconut Grove outpaced a cooling national real estate market by setting new, all-time records across multiple categories.
I am a Groveite through and through. I met my wife in the Grove 13 years ago, was married in the Grove (St. Hugh), my reception was in the Grove (Villa Woodbine), I have lived in the Grove for the past 13 years, and I am the Executive Director of Luxury Sales at Douglas Elliman in our Grove office at Two CocoWalk. I have put together this report for the past 9 years because I care about the health of our community and helping people understand where the Grove housing market has been and is headed.
The overall market in South Florida exploded in 2021 and continued in 2022 due to an enormous influx of buyers from New York, Chicago and L.A. because of our favorable tax rates, Covid and “the way that Florida is being run” – (that last one being the most popular answer when asking buyers “why Florida?”).
The Coconut Grove real estate market had increased year-over-year for 8 consecutive years until it exploded in 2020 and then basically shattered every metric ever tabulated in 2021…and then did it again in 2022 by most metrics. Here are some takeaways from the 2022 numbers:
- Total sales volume in ALL of the Grove fell sharply from 2021’s record number of $1,452,047,154 to $855,771,046 in 2022; BUT…
- The average sales price in ALL of the Grove set another all-time high at $1,824,672 , an 88.5% jump from $968,237 in 2019 (pre-Covid).
- The average sales price per square foot in ALL of the Grove also set another new, all-time high at $813.28, a 27.8% jump over the previous high of $636.63 in 2021 and completely destroying the pre-Covid 2019 high of $431.92 by a staggering 88.3%.
- South Grove was the first neighborhood to EVER break the $1,000 per sq/ft average when it hit $1,042.48 in 2022!
- Average days on market in ALL of the Grove hit its lowest number ever with properties only being on the market for 48 days before going under contract.
Coconut Grove Real Estate – Months of Supply (February 2023)
Months of supply means how long it would take for the market to absorb all real estate, if no additional real estate came to market. This stat determines whether it is a Buyer’s Market or Seller’s Market. When looking at statistics, having a 6-month supply or less favors sellers while more than 6 months favors buyers.
Single-Family Homes: 8.3-Month Supply (Buyer’s Market)
83 Currently Available
60 Sold in Past 6 Months
Condos: 5-Month Supply (Slight Seller’s Market)
62 Currently Available
75 Sold in Past 6 Months
Townhomes: 5.2-Month Supply ( Slight Seller’s Market)
20 Currently Available
23 Sold in Past 6 Months
Below, I have laid out all of the 2022 Coconut Grove real estate statistics and then a year-over-year comparison of 2022 versus 2021.
2022 Coconut Grove Real Estate Sales by the Numbers:
- Total Number of Sales: 469
- Total Sales Volume: $855,771,046
- Average List Price: $1,896,882
- Median List Price: $1,399,000
- Average Sales Price: $1,824,672 (96.2% of List Price)
- Median Sales Price: $1,350,000 (96.5% of List Price)
- Average Sales Price Per SQ/FT: $813.28
- Median Sales Price Per SQ/FT: $708.44
- Days on Market: 48 Average / 23 Median
- Highest Priced Sale of 2022: 1800 S. Bayshore Ln. Closed on 07/29/2022 @ $15,000,000 ($2,241.82 per sq/ft)
- Lowest Priced Sale of 2022: 2630 SW 28th St. #46 Closed on 03/01/2022 @ $165,000 ($342.32 per sq/ft)
Download: 2022 ALL Coconut Grove Real Estate Sales Data
2022 vs. 2021 ALL Coconut Grove Sales Year-Over-Year Numbers:
- Total Number of Sales: DOWN 331 (-41.4%) | 469 in 2022 vs. 800 in 2021 (492 in 2020)
- Total Sales Volume: DOWN $596,276,108 (-41.0%) | $855,771,046 in 2022 vs. $1,452,047,154 in 2021 ($541,812,781 in 2020 ($476,234,676 in 2019)
- Average List Price: DOWN $17,114 (-0.9%) | $1,896,882 in 2022 vs. $1,913,996 in 2021 ($1,188,287 in 2020 ($1,043,411 in 2019)
- Median List Price: UP $226,500 (+19.3%) | $1,399,000 in 2022 vs. $1,172,500 in 2021 ($875,000 in 2020 ($798,500 in 2019)
- Average Sales Price: UP $9,613 (+0.5%) | $1,824,672 in 2022 vs. $1,815,059 in 2021 ($1,101,245 in 2020 ($968,237 in 2019)
- Median Sales Price: UP $250,000 (+22.7%) | $1,350,000 in 2022 vs. $1,100,000 in 2021 ($811,000 in 2020 ($747,500 in 2019)
- Average Sales Price Per SQ/FT: UP $176.65 (+27.8%) | $813.28 in 2022 vs. $636.63 in 2021 ($459.27 in 2020 ($431.92 in 2019)
- Median Sales Price Per SQ/FT: UP $155.80 (+28.2%) | $708.44 in 2022 vs. $552.64 in 2021 ($410.28 in 2020 ($393.70 in 2019)
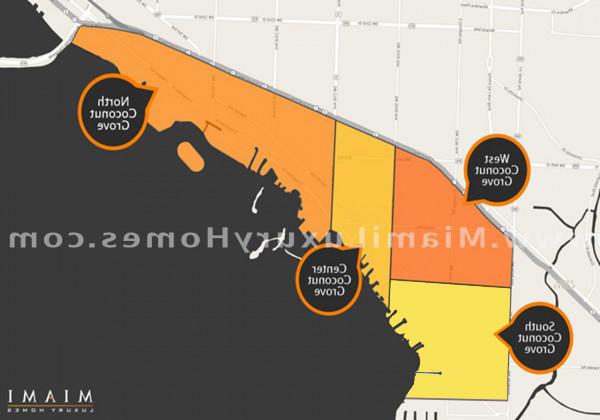
To local Groveites looking to sell, and buyers purchasing property in Coconut Grove, I have broken down the statistics of the different areas of the Grove. Coconut Grove is locally referred to in parts, i.e. North, South, Center and West (for example, CocoWalk and Mr. C Hotel are both located in Center Grove and Kennedy Park is located in North Grove).
2022 vs. 2021 NORTH Coconut Grove Sales by the Numbers:
- Total Number of Sales: 155 in 2022 | 281 in 2021 (192 in 2020)
- Average List Price: $2,368,218 in 2022 | $2,080,521 in 2021 ($1,427,992 in 2020)
- Median List Price: $1,975,000 in 2022 | $1,349,000 in 2021 ($1,100,000 in 2020)
- Average Sales Price: (+15.4%) $2,255,965 in 2022 | $1,954,750 in 2021 ($1,303,196 in 2020)
- Median Sales Price: (+41.0%) $1,833,000 in 2022 | $1,300,000 in 2021 ($1,050,000 in 2020)
- Average Sales Price Per SQ/FT: (+33.9%) $869.96 in 2022 | $649.80 in 2021 ($473.26 in 2020)
- Median Sales Price Per SQ/FT: (+36.0%) $811.79 in 2022 | $596.97 in 2021 ($436.72 in 2020)
- Days on Market: 50 Average | 30 Median in 2022 (95 Average | 45 Median in 2021)
- Highest Priced Sale of 2022: 1800 S. Bayshore Ln. Closed on 07/29/2022 @ $15,000,000 ($2,241.82per sq/ft)
- Lowest Priced Sale of 2022: 2630 SW 28th St. #46 Closed on 03/01/2022 @ $165,000 ($342.32 per sq/ft)
2022 vs. 2021 SOUTH Coconut Grove Sales by the Numbers:
- Total Number of Sales: 40 in 2022 | 112 in 2021 (54 in 2020)
- Average List Price: $4,239,297 in 2022 | $3,792,882 in 2021 ($2,003,343 in 2020)
- Median List Price: $3,172,500 in 2022 | $2,287,450 in 2021 ($1,519,000 in 2020)
- Average Sales Price: (+13.0%) $4,069,500 in 2022 | $3,602,096 in 2021 ($1,878,919 in 2020)
- Median Sales Price: (+26.9%) $2,900,000 in 2022 | $2,286,060 in 2021 ($1,387,500 in 2020)
- Average Sales Price Per SQ/FT: (+36.4%) $1,042.48 in 2022 | $764.06 in 2021 ($538.08 in 2020)
- Median Sales Price Per SQ/FT: (+44.9%) $973.45 in 2022 | $671.69 in 2021 ($501.22 in 2020)
- Days on Market: 40 Average | 21 Median in 2022 (82 Average | 37 Median in 2021)
- Highest Priced Sale of 2022: 3467 N. Moorings Way Closed on 10/17/2022 @ $14,700,000 ($2,345.25 per sq/ft)
- Lowest Priced Sale of 2022: 4178 El Prado Blvd. Closed on 01/24/2022 @ $858,000 (Land Sale)
2022 vs. 2021 CENTER Coconut Grove Sales by the Numbers:
- Total Number of Sales: 201 in 2022 | 289 in 2021 (155 in 2020)
- Average List Price: $1,209,295 in 2022 | $1,239,859 in 2021 ($765,628 in 2020)
- Median List Price: $850,000 in 2022 | $729,000 in 2021 ($589,000 in 2020)
- Average Sales Price: (-1.0%) $1,173,432 in 2022 | $1,184,823 in 2021 ($717,214 in 2020)
- Median Sales Price: (+16.7%) $816,563 in 2022 | $700,000 in 2021 ($560,000 in 2020)
- Average Sales Price Per SQ/FT: (+21.7%) $748.28 in 2022 | $614.85 in 2021 ($447.12 in 2020)
- Median Sales Price Per SQ/FT: (+26.2%) $630.58 in 2022 | $499.68 in 2021 ($387.17 in 2020)
- Days on Market: 48 Average | 18 Median in 2022 (88 Average | 43 Median in 2021)
- Highest Priced Sale of 2022: 3503 Wildwood Cir. Closed on 01/28/2022 @ $8,700,000 ($1,469.10 per sq/ft)
- Lowest Priced Sale of 2022: 3245 Virginia St. #38 Closed on 08/31/2022 @ $220,000 ($428.02 per sq/ft)
2022 vs. 2021 WEST Coconut Grove Sales by the Numbers:
- Total Number of Sales: 75 in 2022 | 119 in 2021 (92 in 2020)
- Average List Price: $1,630,657 in 2022 | $1,384,312 in 2021 ($913,367 in 2020)
- Median List Price: $1,237,562 in 2022 | $1,200,000 in 2021 ($787,500 in 2020)
- Average Sales Price: (+18.5%) $1,575,181 in 2022 | $1,329,108 in 2021 ($862,709 in 2020)
- Median Sales Price: (+7.5%) $1,225,000 in 2022 | $1,140,000 in 2021 ($760,000 in 2020)
- Average Sales Price Per SQ/FT: (+36.2%) $736.28 in 2022 | $540.77 in 2021 ($402.47 in 2020)
- Median Sales Price Per SQ/FT: (+39.0%) $686.81 in 2022 | $494.14 in 2021 ($388.44 in 2020)
- Days on Market: 50 Average | 31 Median in 2022 (83 Average | 34 Median in 2021)
- Highest Priced Sale of 2022: 3316 Devon Ct. Closed on 05/25/2022 @ $10,500,000 ($944.50 per sq/ft)
- Lowest Priced Sale of 2022: 3615 Thomas Ave. #16 Closed on 11/09/2022 @ $182,000 ($390.56 per sq/ft)
If you, or someone you know, would like to purchase or sell real estate in Coconut Grove, please contact me, Michael Light, Founder/Owner of the Light Group at Douglas Elliman Real Estate. I am a resident of Coconut Grove and have direct knowledge of the Coconut Grove real estate market. You may reach me directly at my CocoWalk office at 305-350-9842, on my cell phone at 786-566-1700 or via email at michael@132072.com.
Looking for past Coconut Grove market statistic articles? Here they are:
2021 Coconut Grove Market Report
2020 Coconut Grove Market Report
2019 Coconut Grove Market Report
2018 Coconut Grove Market Report
2017 Coconut Grove Market Report
2016 Coconut Grove Market Report
2015 Coconut Grove Market Report
2014 Coconut Grove Market Report


